LPD Logo

LEAN PRODUCT DESIGN

design to cost

DON'T JUST BUILD PRODUCTS. BUILD INDUSTRY BENCHMARKS!

Our comprehensive review processes elevate your product and build your competitive advantage through smart, cost-driven engineering.

MAXIMIZE VALUE, MINIMIZE WASTED COST

Unlock hidden margin potential in your existing lines or design upcoming products with precise financial benchmarks from day one.

PROFESSIONAL OUTPUT. MEASURABLE IMPACT.

Secure your margins with our detailed, structured reporting. We deliver comprehensive ROI and BCC analyses that translate directly into actionable manufacturing strategies.

80+ Products Reviewed

Extensive analysis and optimization across diverse highly competitive product categories.

20+ Years Experience

In-depth expertise built directly within tier 1 automotive supplier environments.

10% Average Cost Reduction

Proven methodologies delivering sustainable cost optimization without compromising quality.

WHAT WE DO

We bring the rigorous, margin-saving methodologies of Tier 1 automotive engineering to the broader market.
Leveraging over 20 years of global experience (EMEA, NAFTA, APAC) in high-stakes product design and continuous optimization, we know exactly where hidden costs live.
We deliver enterprise-level expertise to help you eliminate waste and maximize your product's profitability.

COST TARGETING

Why
  • Clear financial framework: Establishing a clear financial framework right from the start keeps the development team grounded in reality.
  • Cost prevention: Setting up costs correctly from the beginning prevents unpleasant surprises and additional budget overruns.
  • Waste elimination: Efficient planning leads to the direct elimination of waste.
What
  • Component pricing: Defining the target price of individual components before the detailed engineering and design phase even begins.
  • BCA & ROI Analysis: Performing thorough Benefit-Cost Analysis (BCA) and Return on Investment (ROI) evaluations.
  • Technical solutions assessment: Evaluating various technical designs and solutions strictly from a cost perspective.
How
  • Independent costing: We calculate the cost of each component independently, utilizing our proprietary and continuously updated database of material prices, manufacturing processes, and energy costs.
  • Competitor benchmarking: To determine the precise target cost, we also actively benchmark competing products on the market.

DESIGN TO COST (DTC)

Why
  • Preventing project creep: Analyzing the design from a cost perspective during key development milestones is essential to eliminate project creep.
  • Risk mitigation: Mitigating the risk of project budget overruns that could directly threaten overall project profitability.
  • Over-engineering prevention: Preventing product over-engineering and eliminating associated waste.
  • Sustainability impact: Optimizing the design has a positive impact on both product and manufacturing sustainability.
What
  • Component-level analysis: Conducting a detailed analysis of individual product components during the design phase to identify alternative technical solutions.
  • Cost vs. Functionality balance: Analyzing every single component to achieve the optimal balance between manufacturing costs and part functionality.
  • Quality preservation: Ensuring that the high quality and primary function of individual components remain fully preserved.
  • Manufacturing & assembly analysis: Reviewing production processes and assembly workflows. We apply over 20 years of experience in optimizing structural assemblies (such as automotive headlights, instrument panels, wiring harnesses, etc.) for mass production, where every minor detail can save millions of euros.
How
  • Cross-functional workshops: The ideal approach is a workshop with the development team. Key participants include professionals responsible for mechanical design, electronics, manufacturing, material procurement, project manager, and sales representatives.
  • Structured review meetings: Review meetings follow a strict agenda focusing on overall concept, aligning functions, and clarifying interdependencies by bringing all stakeholders into one room.
  • BOM-driven component analysis: A methodical component-by-component analysis is conducted, structured by the Bill of Materials (BOM). Not even the smallest part is skipped.
  • Detailed part review: Each component undergoes a thorough evaluation, analyzing the material selection, manufacturing process, and geometry.
  • DTC reporting & tracking: Opportunities are documented in a DTC report containing descriptions, estimated savings, implementation costs, and owners, while progress is continuously monitored.

VAVE (Value Analysis / Value Engineering)

Why
  • Profit stabilization: A VAVE workshop is a fundamental tool for stabilizing project profitability when threatened by external factors—such as drops in production volume, rising input costs, or aggressive new low-cost competitors.
  • KPI improvement: It serves as an effective mechanism for improving project KPIs at a stage when the first physical prototypes are already available.
What
  • Industrial-phase product review: A thorough review of the product during its industrialization phase. Although design changes are more restricted at this stage, insights gained from initial production tooling and prototypes still offer a significant opportunity to optimize project profitability.
How
  • Cross-functional team alignment: The VAVE workshop brings together the entire project execution team—including R&D, Procurement, Manufacturing, and the Project Manager.
  • End-to-end process review: Together, the team maps and reviews the entire production chain: from the manufacturing of individual components, through logistics and assembly, up to final quality inspection, packaging, and distribution to the end customer.

CASE STUDIES

Examples of our work. See how we apply Design to Cost and VAVE methodologies in product design.

Please note: While these case studies represent real projects and actual savings, certain technical specifications and visuals have been modified or replaced with AI-generated illustrations to safeguard our clients' sensitive data.

Plastics & Injection Molding

WALL THICKNESS OPTIMIZATION OF CAR HEADLAMP HOUSING

Moldflow simulation

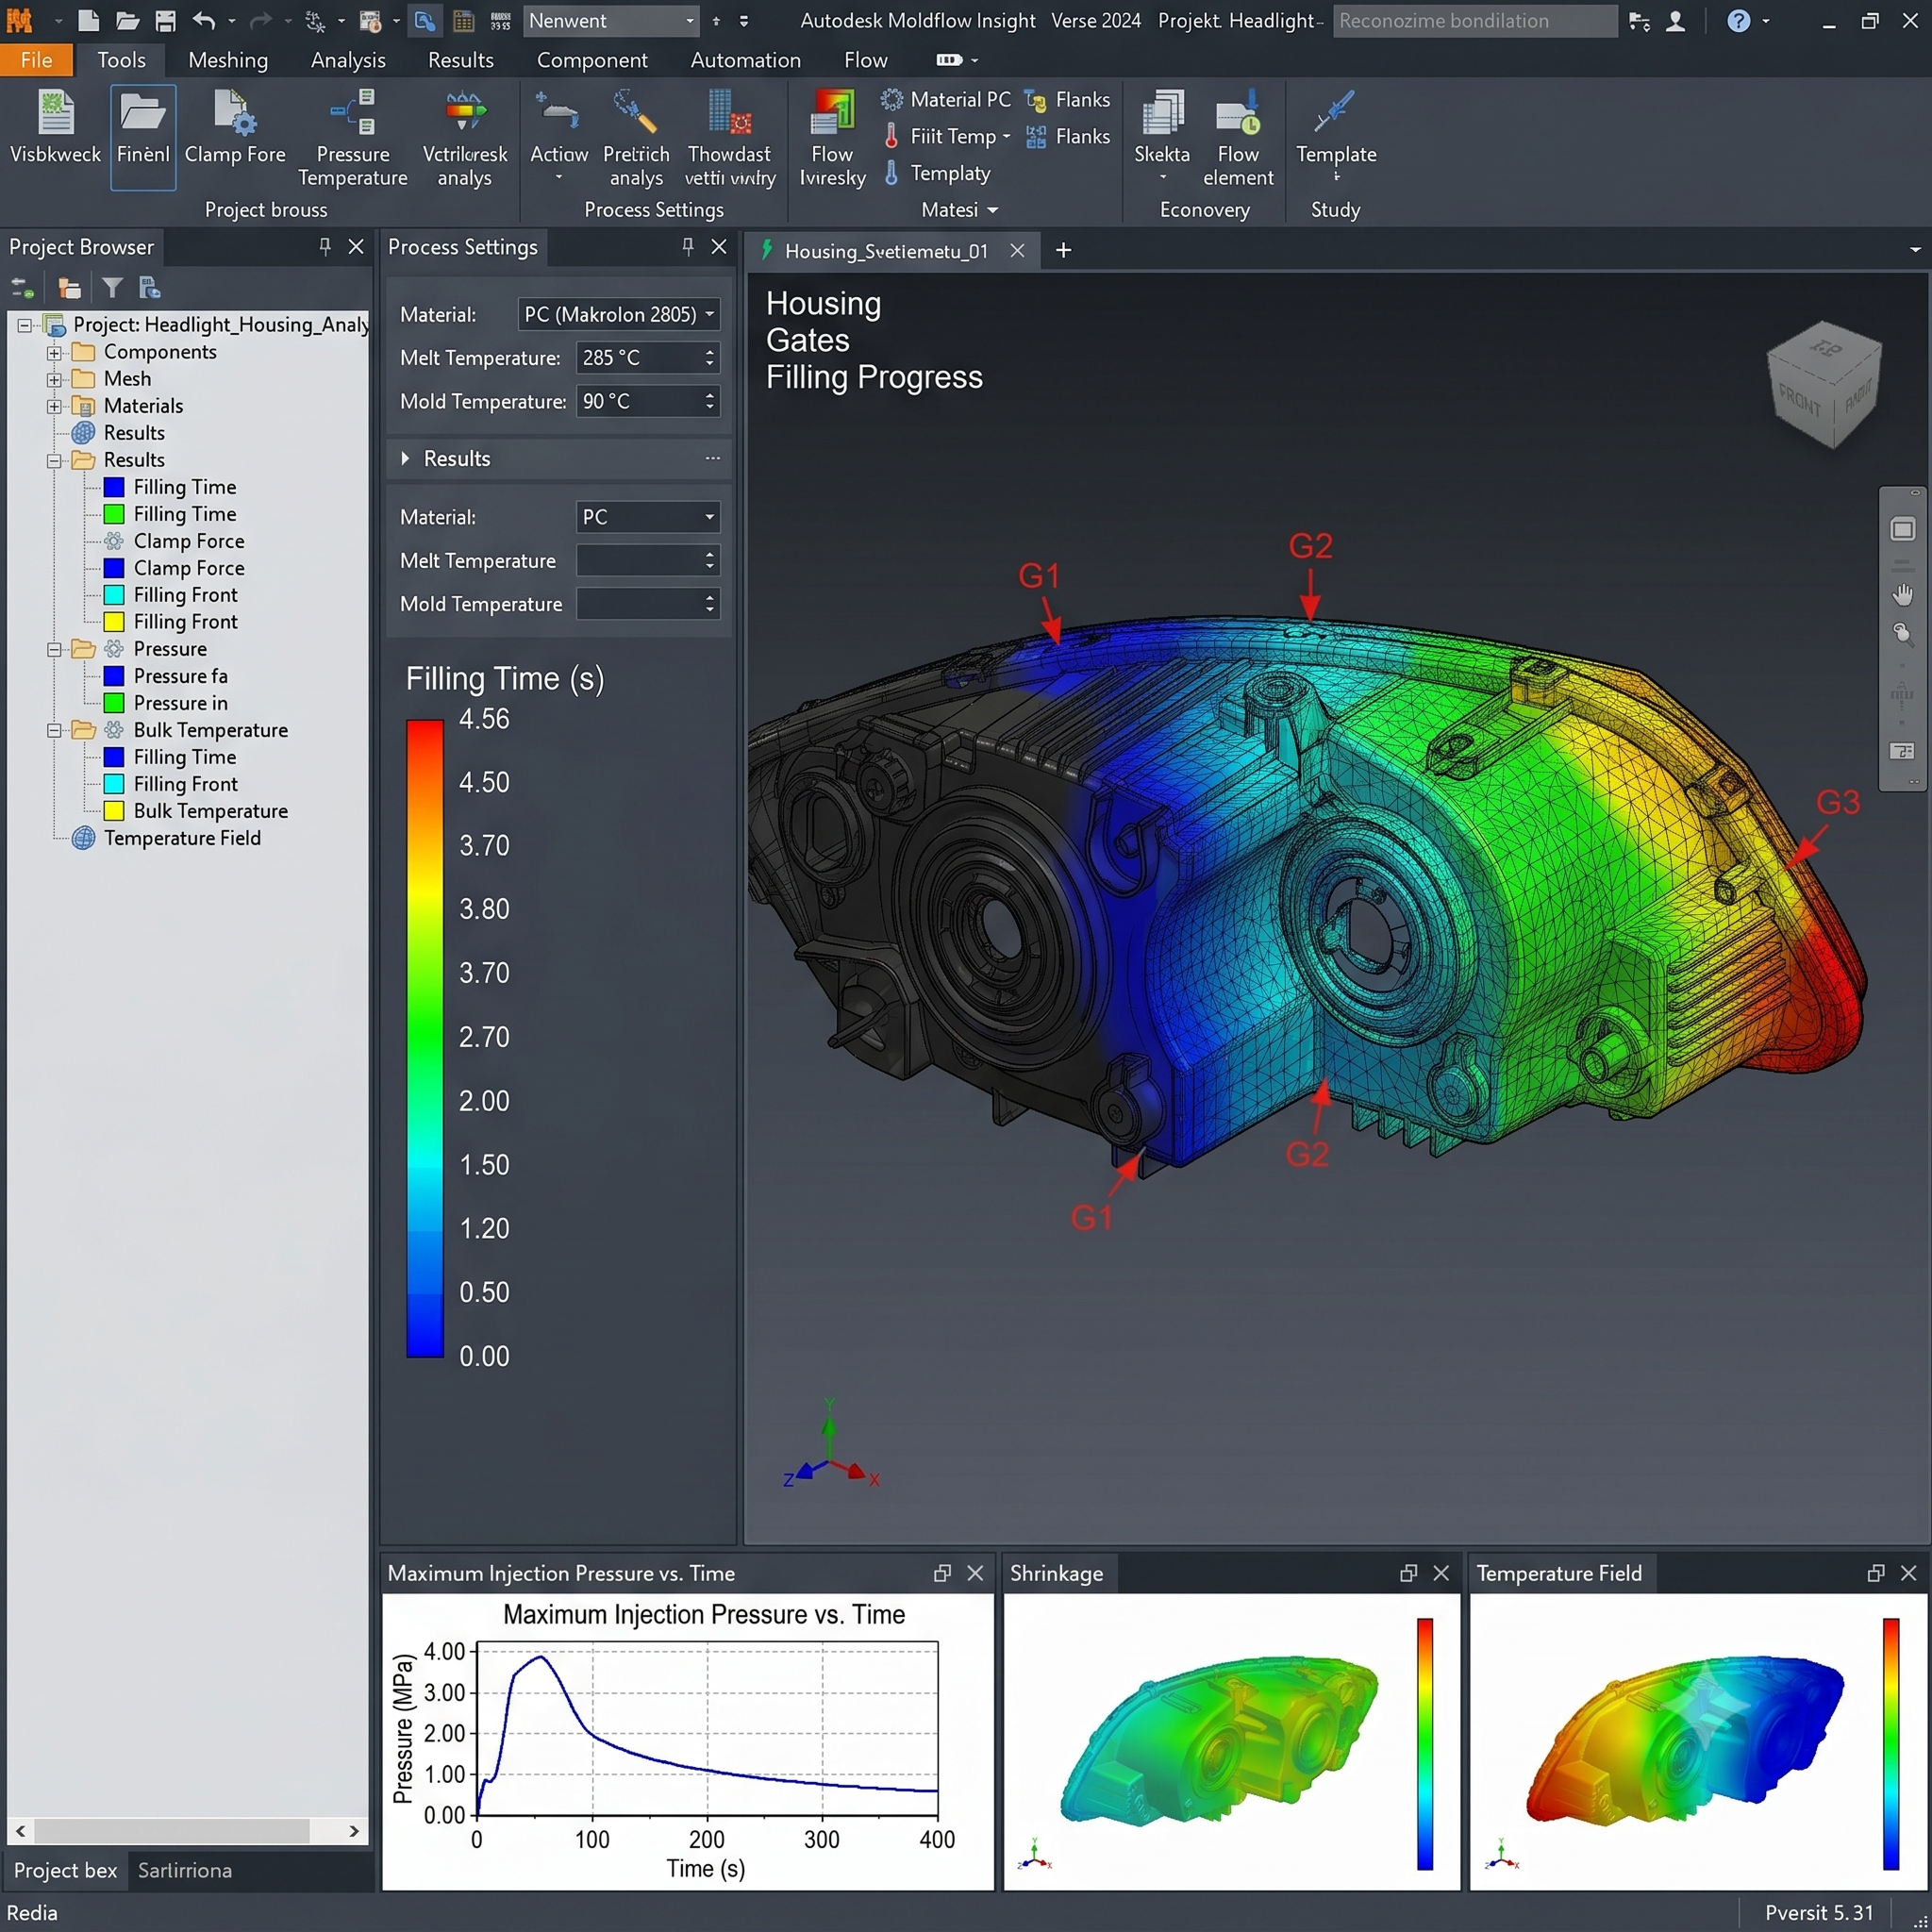
The average wall thickness values seen in current headlamps range from 2.0 to 2.3 mm. By aggressively targeting a 1.6 mm benchmark, we unlock significant savings in raw materials, logistics, and carbon footprint without compromising part functionality.

Designs are validated via Moldflow and FEM simulations; a 'pass' result often stops further optimization. A 'green' simulation should be the starting point for refinement, not the finish line. Currently, significant safety margins remain unchallenged, leaving untapped savings on the table. We should change our mindset from "Is it safe?" to "How thin can a part be and still be safe?"

Example calculation:

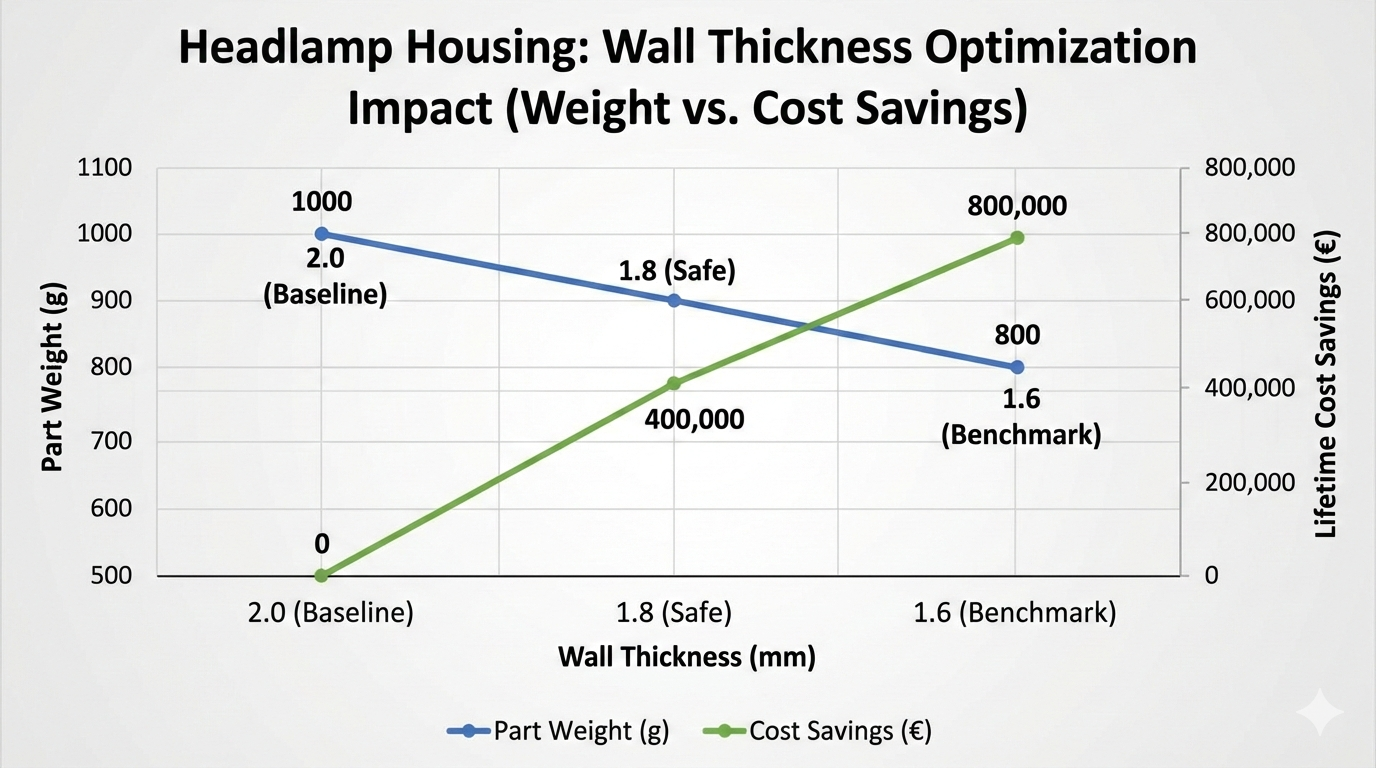
C-Segment (Skoda Octavia, Peugeot 308, Kia Ceed)

800,000 Cars / 1.6 M Pcs | Material: PP GF30 | Cost: 2.5 €/kg

Parameter

Baseline

(2.0 mm)

Safe target

(1.8 mm)

Benchmark

(1.6 mm)

Part Weight 1 000 g 900 g 800 g
Material Saved / Car - 0.2 kg 0.4 kg
Lifetime Material Saved - 160 Tons 320 Tons
Material Cost Saving - 400 000 € 800 000 €
Wall Thickness Optimization
Sustainability impact:
320 Tons of plastic material saved - that's 14 Full Load 24 Tons trucks. Lower weight of the part / vehicle means less CO2 emissions.
Wire Harnesses & Electronics

WIRE HARNESS OPTIMIZATION

Revision and simplification of complex wiring harnesses to reduce material costs and speed up assembly. By revising routing, cable types, connectors, and other components, total costs can be significantly reduced.

Parameter Baseline Optimized State
Total wire length (0.5 mm2)

28.5 m

=>

20.2 m

0.07 €/m
Connectors optimization

11x SMT

=>

11x Edge board

cca 0.15 € cheaper
Number of splices

9

=>

5

0.20 €/splice
Cost Savings - 2.90 €
Note:
Many details are often missed during wire harness design. They are frequently over-specified, even though they are usually among the most expensive components in a product.
Electronics & Hardware

PCBA SIZE AND SHAPE OPTIMIZATION

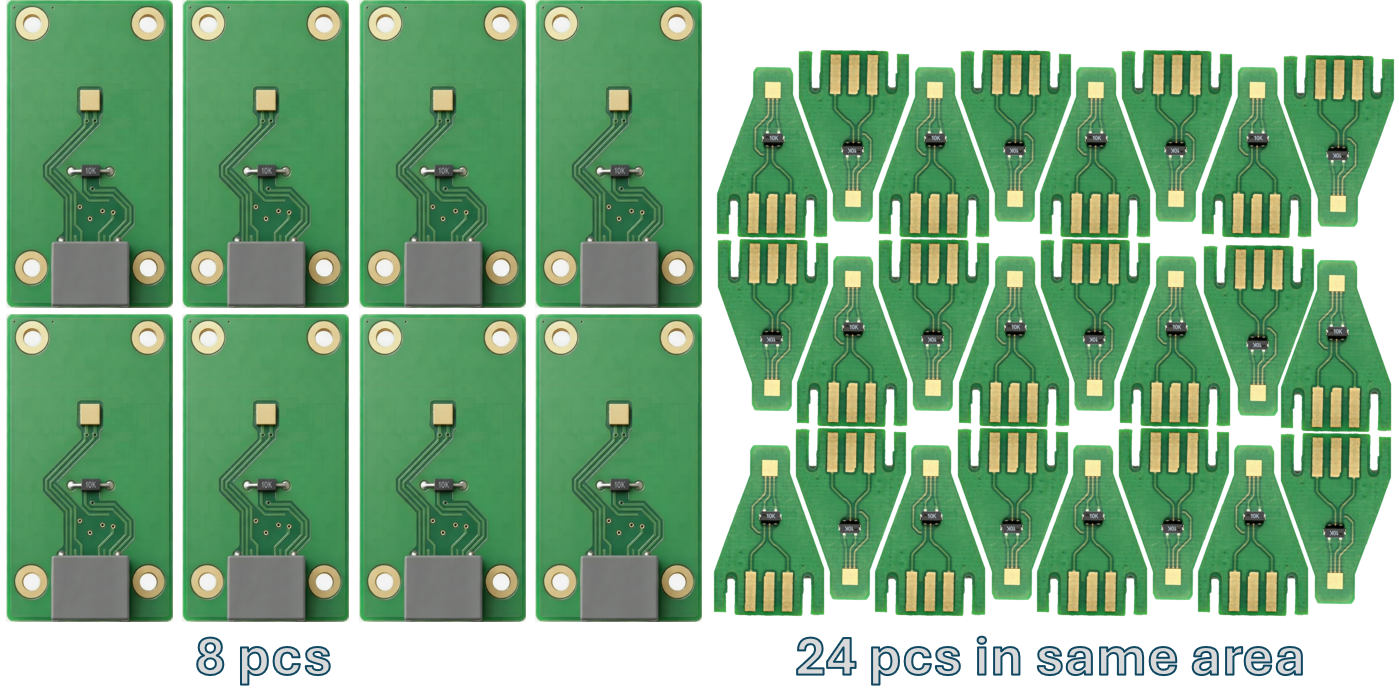
In many designs we can see that PCBA shape and size is often driven by mechanical design needs, resulting in very expensive material being used for fixation or to prevent light leakage. PCBAs should be designed as small as possible.

It is common for PCBA dimensions to be dictated by the mechanical enclosure. However, a Design to Cost (DTC) approach requires an "inside-out" methodology where function dictates form.

The "Inside-Out" Design Philosophy:

Prioritize Functional Core: Begin by placing primary components (LEDs, ICs, Controllers) to establish the tightest possible footprint.

Thermal-First Layout: Allocate area for heat dissipation and clearance based on actual thermal load rather than arbitrary box dimensions.

High-Density Passive Placement: Integrate secondary components (NTCs, resistors, connectors) as densely as thermal physics permits.

Geometric Optimization: Aim for a rectangular footprint to minimize PCB panel waste.

Peripheral Mounting: Utilize edge-castellated holes (half-holes) for mounting. This preserves the internal routing layers and allows mechanical designers to secure the board via stepped housing features rather than intrusive internal screws.

Overcoming the "Green Light Effect": Many teams fall victim to the "Green Light Effect"—the tendency to stop optimizing once a design is functional. To achieve a truly cost-optimized product, we must challenge "working" designs to find the limit of minimal material usage.

Parameter Baseline Optimized State Saving
PCB Shape/Size

23.1 mm2

30 pcs/panel

7.8 mm2

90 pcs/panel

0.26 €

PCB

Connector SMT 6-pin Edge board

0.19 €

PCB

Technology

FR4 +

Heat Sink

Alu IMS

No Heat Sink

0.80 €

Heat Sink

Total system cost reduction 1.30 €

PCBA Size Optimization
Design to Cost & Concept Optimization

CONCEPT DESIGN OPTIMIZATION

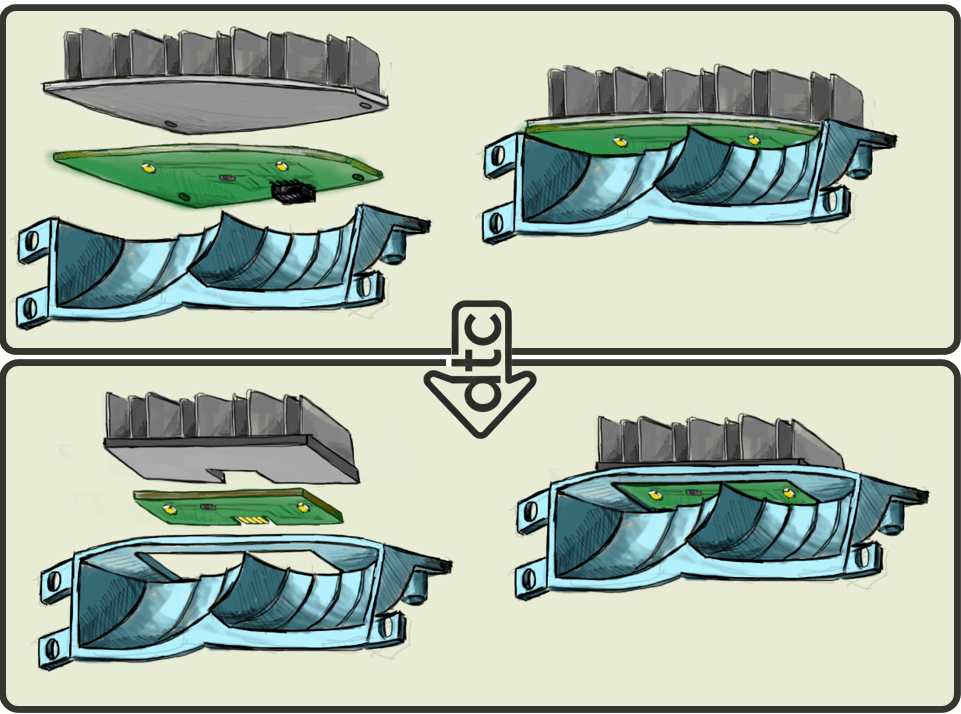
Evaluating a concept during the design phase, with a strict focus on cost-effectiveness and competitiveness, is essential for delivering a successful and profitable product. Each proposal needs to be checked in context to other parts. Sometimes using more expensive material for one part may result in eliminating other parts completely making the total product cost lower.

Example calculation:

Small sub-assembly of LED reflector

Volume: 1 400 000 Cars / 2 800 000 Pcs

Component Optimization Cost savings
PCBA Size and Shape

Reduced to functional minimum

10 pcs/panel -> 48 pcs/panel

0.95 €
Heat Sink

30% smaller

Die cast -> Sheet metal

0.60 €
Connector

5-pin SMT

->

5-pin Edgeboard

0.20 €
Reflector

PC-HT -> PC

weight reduced by 50 g

0.80 €
Screws

4 Screws

-> 2 Screws

0.08 €
Total cost savings

7 300 000 €

life time

2.63 €

product

Concept design optimization
What we did:
We applied several actions for overall optimization of this small sub-assembly. Strictly following simple rule - focus on function, eliminate ballast.
1st step was PCBA optimization - place the essential components (LEDs), add components required for proper function (NTC, Connector, LED driver...), we used cost effective components like edge-board connector and in the end add some extra space on PCB for mechanical fixation.
2nd step was mechanical parts optimization. Reduce heat sink size according to thermal simulations. Change reflector material and wall thickness.
3rd step was assembly optimization. Replace screws with clips, check if thermal paste is needed.

Interactive savings calculator

Use sliders to input approximate values of your production volume and unit cost and see potential impact of savings in one year.

10 000
250

Potential savings over one year.

Conservative savings (5%): 0 EUR
Potential savings (10%): 0 EUR

Let's Talk About Your Product

Do you want to reduce your product's manufacturing costs by 10% or more? Contact us for an initial consultation.

All initial consultations and project data are treated with strict, NDA-level confidentiality.